


One of my goals with Questionable To Start is to be as honest as possible as to the limitations of my database. I don’t think my database is perfect. I don’t think it’s going to revolutionize anything. But I do think that, in a murky world of partial knowledge where everyone seems to have a motivation to conceal the truth, my database could be a very useful tool. In my, “about injury estimates,” page, I outlined some of my choices in regards to how I log injuries, and how those choices might be viewed as subjective and biased. Here, I’d like to go into further (boring) detail about how I treat re-inuries in my return-to-play charts. Mostly I just want to ensure that my treatment is transparent and understandable to everyone.
A big question I ask myself is how I should deal with re-injuries. Let’s say a WR misses two games with a left hamstring strain, then misses two more games later the same season with another left hamstring strain. In one sense, the player has missed two games and then another two games with separate injuries. In another sense, the player has missed four games with the same injury. In trying to figure out how to present this data, I reflected on my goals for my work. I feel like one of the most glaring omissions in current NFL injury coverage is that people are often missing the true cost of an injury. Injury rehab timelines are condensed down into economical phrases such as, “two to four weeks,” without any acknowledgement that many players who have had this injury had rehabs that did not fall within that window. Similarly, people are often overlooking the heightened risk of re-injury that occurs with some injuries. One concussion makes future concussions both more likely and more severe. One dislocation can make future dislocations of the same joint more common. One soft tissue injury such as a hamstring strain can make future hamstring strains all the more likely.
With this in mind, I made what I felt was an obvious judgement call. I decided that in my charts, I would show re-injuries as continuations of previous injuries. To be clear, I decided that, in that above example, that WR would be listed as having one injury that caused him to miss four weeks, rather than two injuries at two weeks apiece. I don’t feel that this is that much of a leap, as it would’ve also been a judgement call had I gone the other way and called them separate injuries.
This decision does not extend to my database. In my database, you will still find that WR as having missed two games, two times. This is simply something I do when generating these RTP charts so that we can see a better true cost of the injury. I only combine these re-injuries when I can be sure it is the same injury during the same season (and obviously to the same player).
I will now pull back the curtain and show you how this works. I’ll use the example of hamstring strains. With my current classification of re-injuries being added together, my RTP chart looks like this:
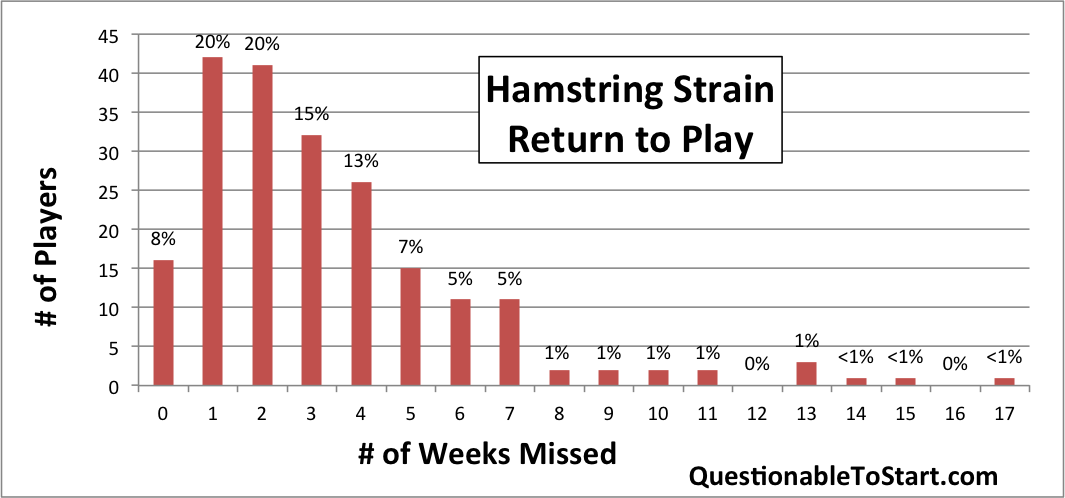
Hamstring strain return-to-play, counting re-injuries as continuations of previous injuries.
But what would a hamstring strain RTP chart look like if I had made a different judgement call? I changed the numbers for the following chart so that it now reflects re-injuries as new, separate injuries (the two weeks plus two weeks rather than four weeks from the example mentioned earlier). Here’s how that would look:
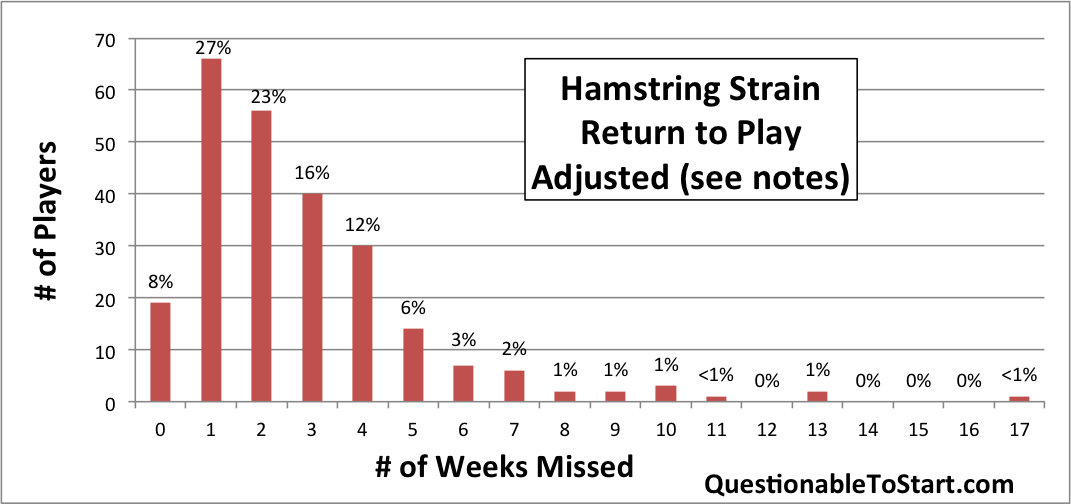
Hamstring strain return-to-play chart with re-injuries counted as new, separate injuries rather than added together.
I’m here if you want to debate the differences. First of all, as I talked about here, my number of players who missed zero games is off. It’s too low. Again, read that piece I linked if you want to learn about that. As far as my re-injury judgement call, I see a few interesting differences between the two charts. Most importantly in my opinion is the fact that we see such different numbers for weeks six and seven. I feel that my original chart gives a better idea of the true cost of the injury by not minimizing these possible injury rehab outcomes. But even I will admit that I’m pretty much just splitting hairs here. One other notable difference between the two is that the weeks one and two outcomes (20% each) on the first chart are so different from the same entries on the second chart (27% and 23%). This indicates that, by my bookkeeping, much fewer players are truly finished with the injury after missing only one or two weeks.
If you care or have your own thoughts on how I’ve tortured the numbers, feel free to sound off in the comments below. If nothing else, I should get credit for being so honest, right?
![]()